Nānā Ikehu
About Nana Ikehu
Nānā Ikehu
Nānā: To see, observe, or inspect Ikehu: Power, intensity, or energy
Welcome to Nānā Ikehu (Seeing Power) Meteor/React application to analyze power usage data, designed for the University of Hawaii at Manoa as part of the Hawaii Annual Code Challenge 2018
What it does
This app visualizes energy usage throughout the University of Hawaii campus through the use of graphs and maps. Users are able to see the amount of energy used for each building by either clicking a building on the campus map, or by selecting a building through the drop down menu.
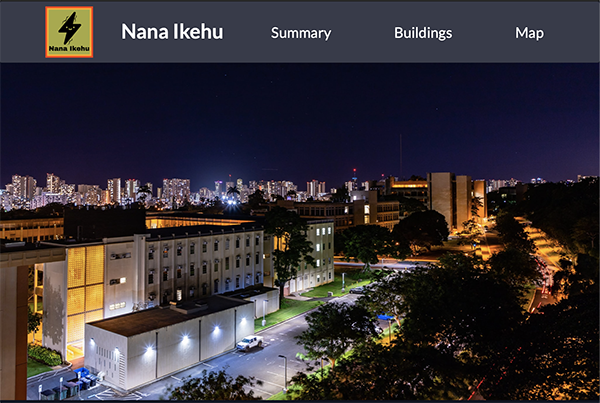
When you come to the site, you are greeted by the following landing page:
The first tab will be summary:
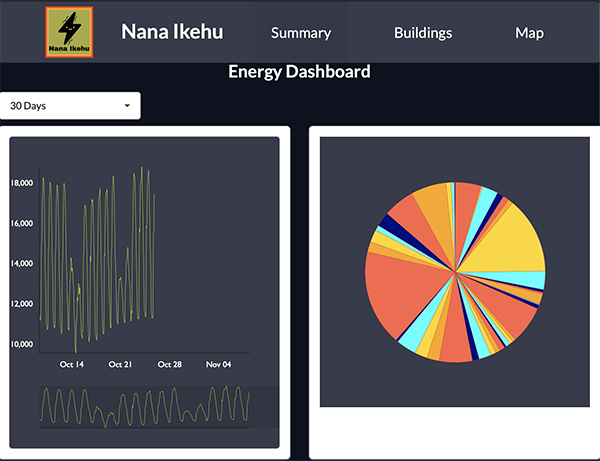
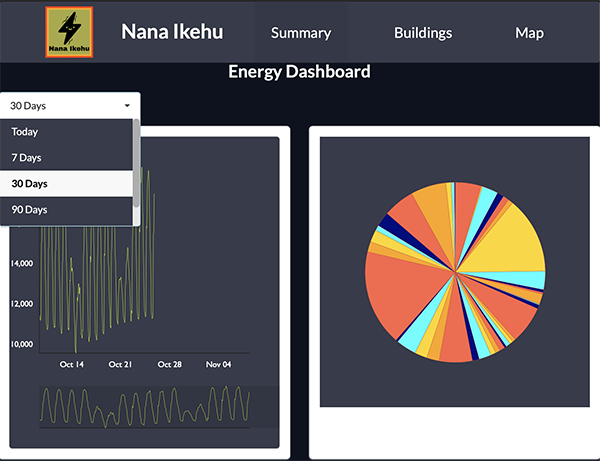
The summary has a dropdown with the range to select:
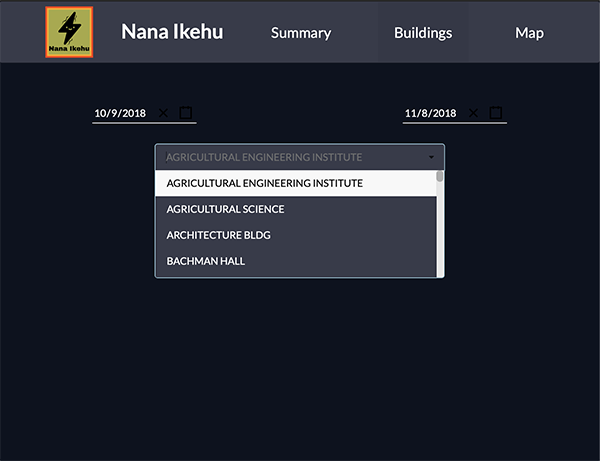
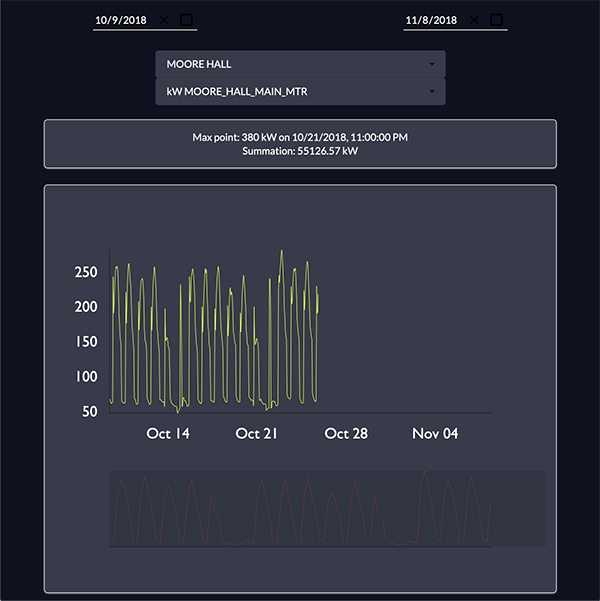
The second tab will be buildings:
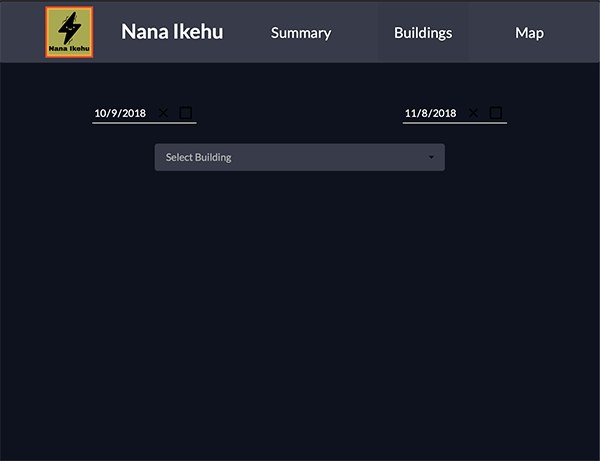
The building has two dropdowns, the first dropdown is the selection of buildings:
The second dropdown is the selection of meter ID:
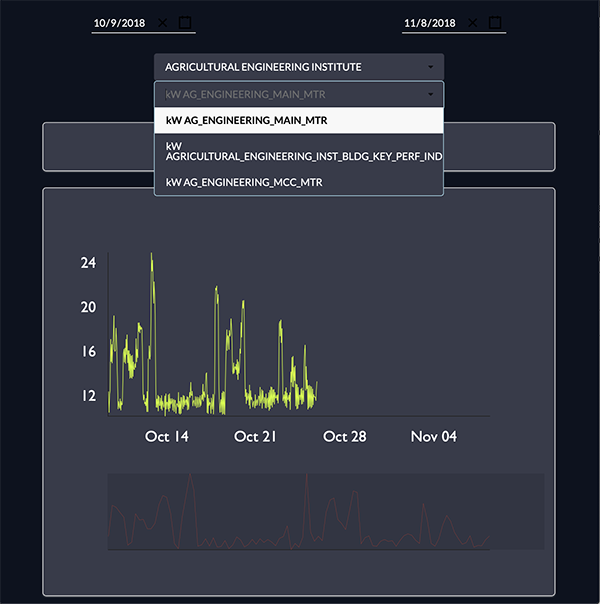
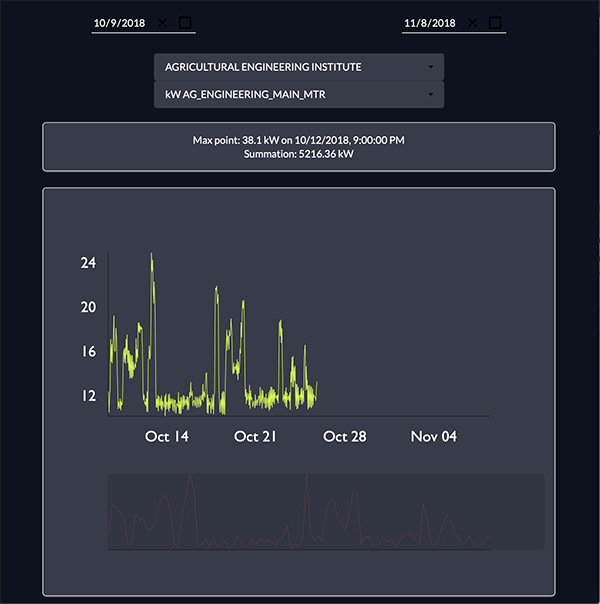
when we selected building and meter ID a graph will be render:
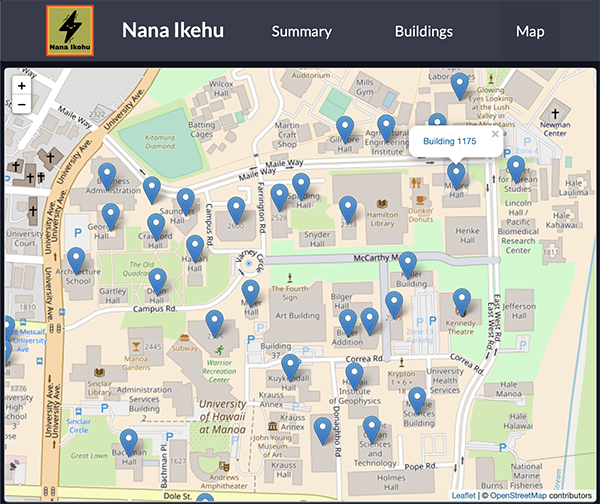
The third tab will be map:
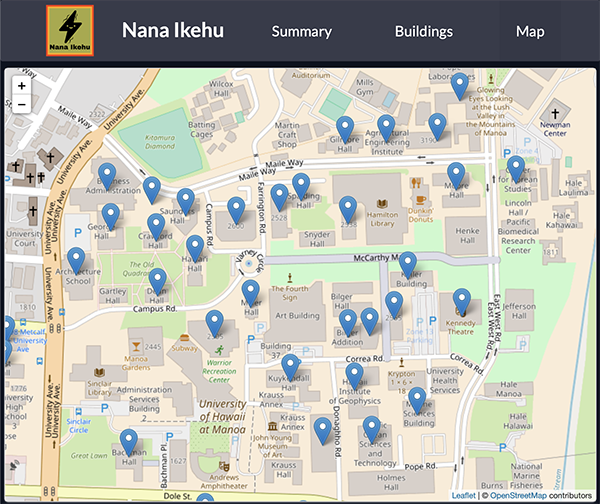
When selecting a building on the map,a pop up will appear with a link to building tab:
When the link is clicked, it will switch to the building tab with the selected building ID. The graph will show the data of the seleted building:
Configuration
Raw database files from Aurora BPA MS-SQL can be exported to CSV for import into this application. Three files must be placed in app/private/files before deploying.
export.csv - Raw data
SampleTsUtc is a timestamp, we do our best to parse any given format
TagLogId matches a meter tag
Mean is the main measurement used for display
Min is used to calculate least demand
Max is used to calculate peak demand
This file can be automatically generated using Aurora BPA MS-SQL with this sample query:
SELECT SampleTsUtc,LogHour.TagLogId
      ,Mean
      ,Min
      ,Max
  FROM [LogHour]
  JOIN LogHourExtension on LogHour.TagLogId = LogHourExtension.TagLogId AND
  LogHour.DayId = LogHourExtension.DayId AND
  LogHour.TimeId = LogHourExtension.TimeId
  JOIN tags.dbo.[TagIds] on LogHour.TagLogId = [TagIds].TagLogId
  where (TagName = 'kw') and Quality = 1;
This query will select needed header fields, reconcile DayId and TimeId values from the Extension table, then filter out high quality power data
BuildingList.csv - Building configuration
Column 1 supplies a unique tag or identifier for a building Column 2 is a friendly name for a building Columns 3,4,5 supply gross square footage, floor count, and room count for the building
TagIds.csv - Meter configuration
BuildingName is a column that matches a building Name
EntityName is a column that supplies a name for a meter
TagLogId is a column that matches the a meter’s tag in the raw data
TagName contains that meter’s unit of measurement
Deployment
If you are not familiar with Meteor it is recommended that you Galaxy or mup to deploy this application.
How we built it
The technologies used include:
- Meteor.js
- React.js
- Semantic-UI
- Victory (Graphs)
Challenges we ran into
During the HACC, we ran into many challenges. It was difficult finding a way to handle such a large amount of data for our app without slowing it down. We also ran into problems with scheduling and role assignments. Due to time constraints and our members busy schedules, we were not able to work on our app as much as we wanted to.
What we learned
This Hackathon demanded of us (in a good way) to build a project portfolio and most importantly, it gives an opportunity for us to learn new experiences with our team. We’ve also learned how to manage our time since the duration of the hackathon is in a very short term, this way actually encouraging us to work with the most productive and efficient method because of limited time.
Accomplishments that we’re proud of and todo
As a team, we are proud of the fact that our application works the way we want to. We see value in providing tighter integration with other data sources and plan to add REST APIs. These APIs will allow other teams to get data from our application transparently as well as allow users to import data in real time using HTTP. We also would like to develop more historical tracking and metrics to further insights.
Role:
In this project, I was a lead SQL person. I developed the MS SQL drivers we needed to import data on into our Meteor instance. I also handled the PapaParse data imports and assisted in getting the Victory graphs working